Joseph Kelly | Old-Growth Labs | Nature Based Solutions
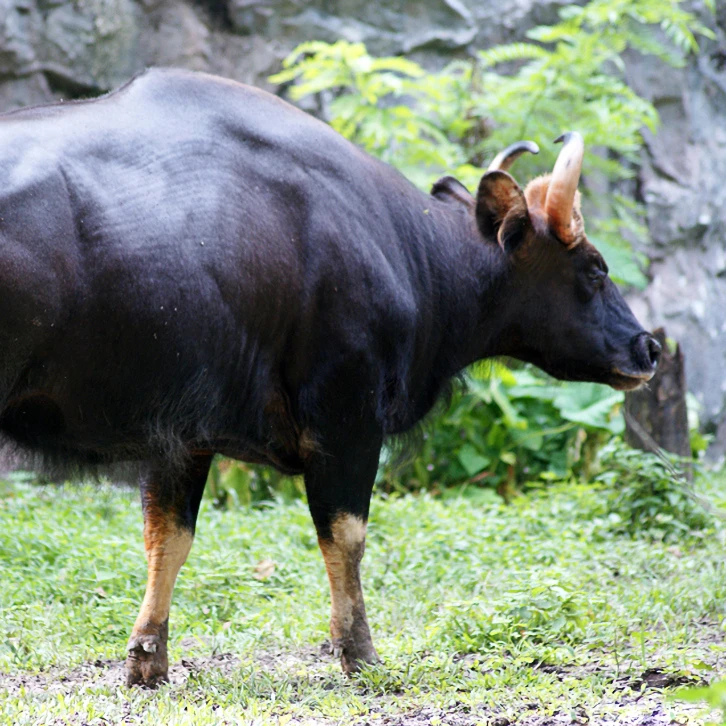
The Malay Peninsula is the southernmost extent of mainland Asia, an equatorial extension forming a tropical biodiversity hotspot. Much of the land has been converted to plantations or managed for commercial timber extraction, but rainforest landscapes persist that are thought to have remained unchanged for millions of years. This stability has allowed complex networks of species assemblages to form, including endemic oddities such as the Mountain Peacock-Pheasant (Polyplectron inopinatum), Robinson’s Forest Dragon (Malayodracon robinsonii) and Kerr's Rafflesia (Rafflesia kerrii), alongside charismatic megafauna such as the Tiger (Panthera tigris), Asian Elephant (Elephas maximus) and Gaur (Bos gaurus). New species are still being described at a surprising rate. For instance, seven new pitcher plant (Nepenthes) species were described between 2020 and 2023 from high-elevation forest and scrub (Tamizi et al., 2025).
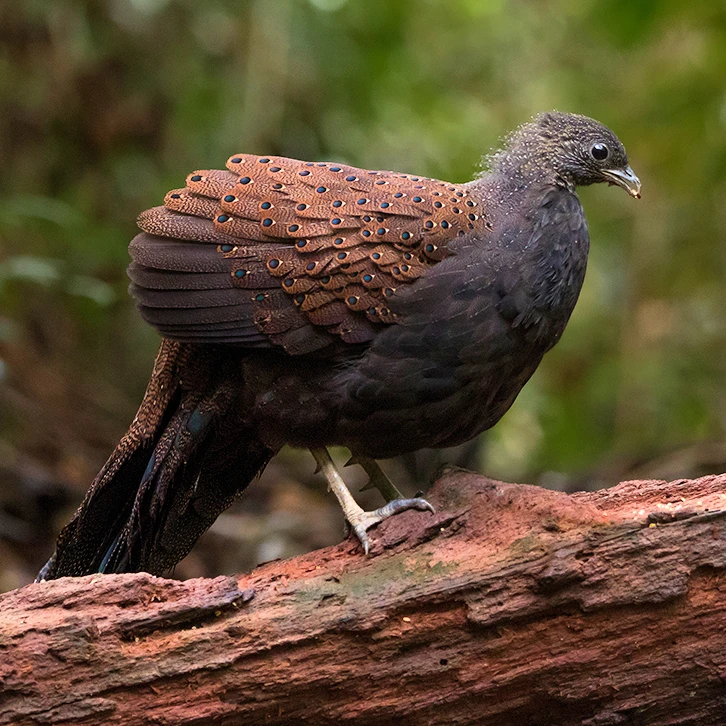
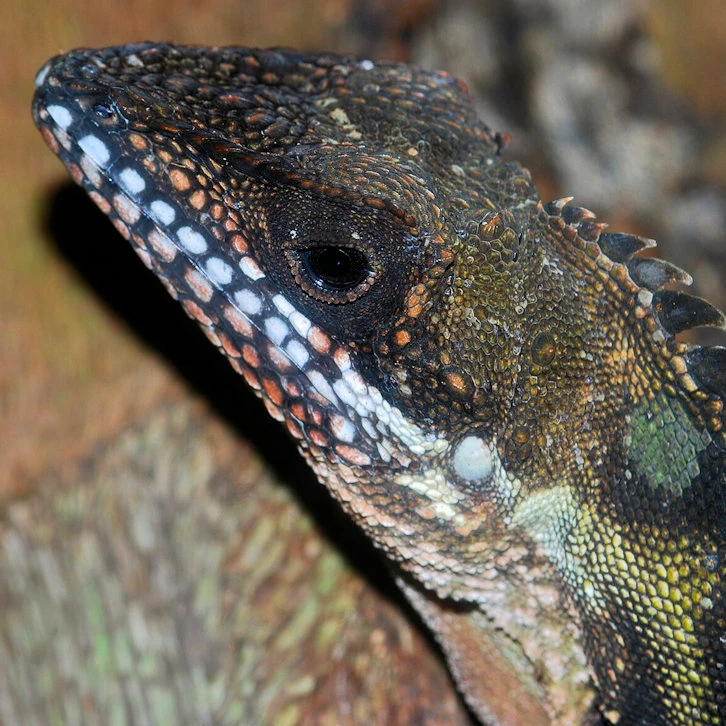
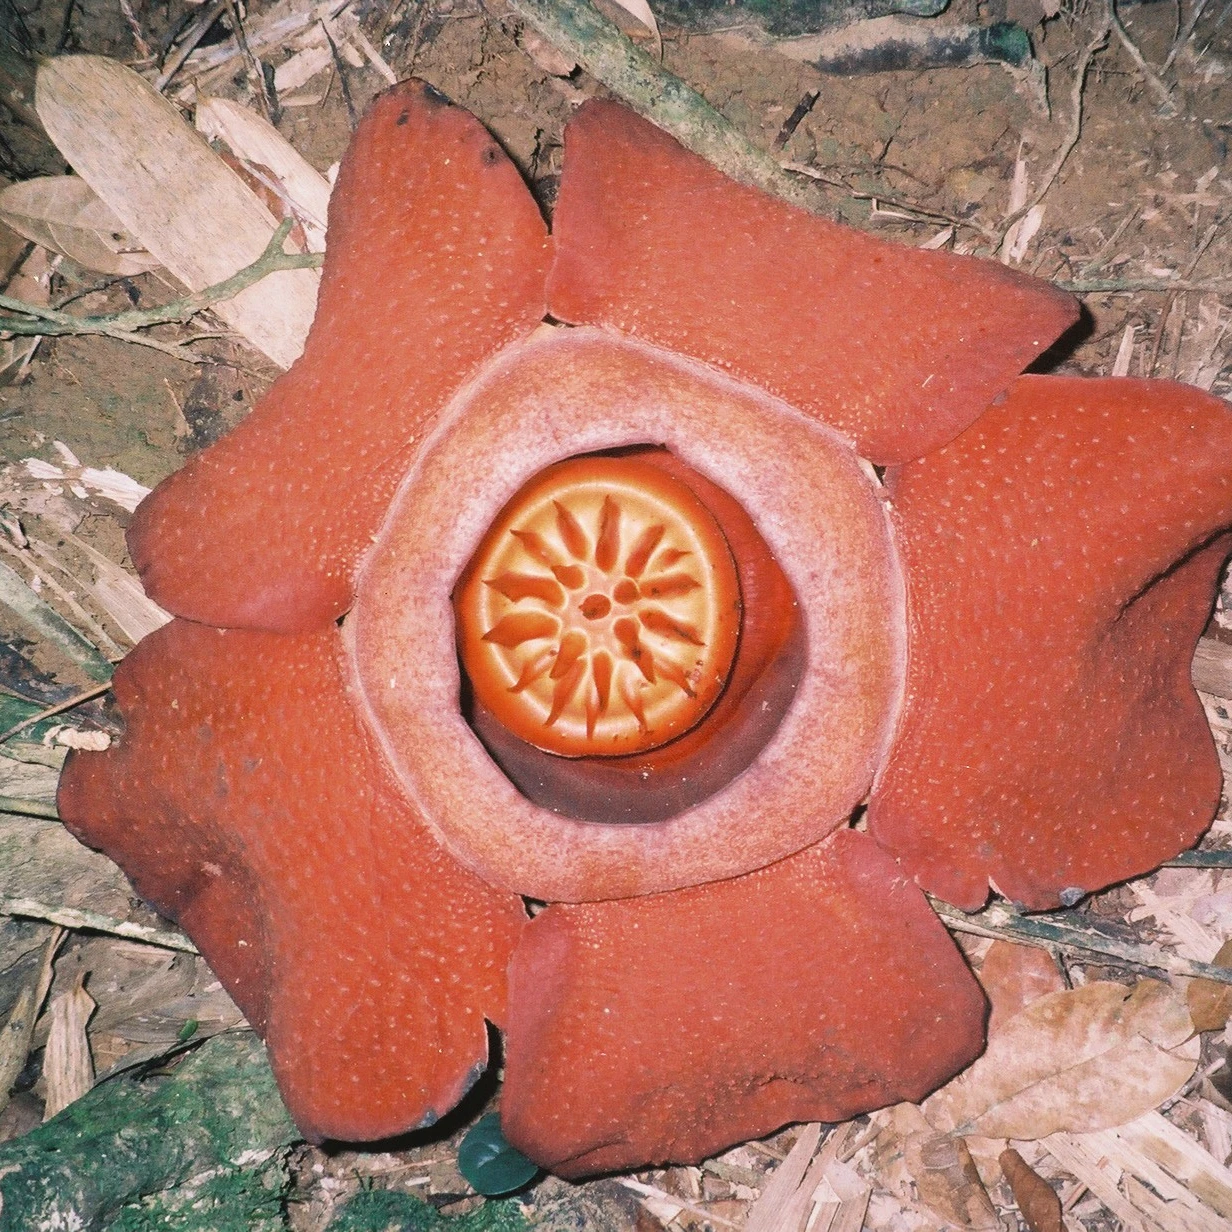

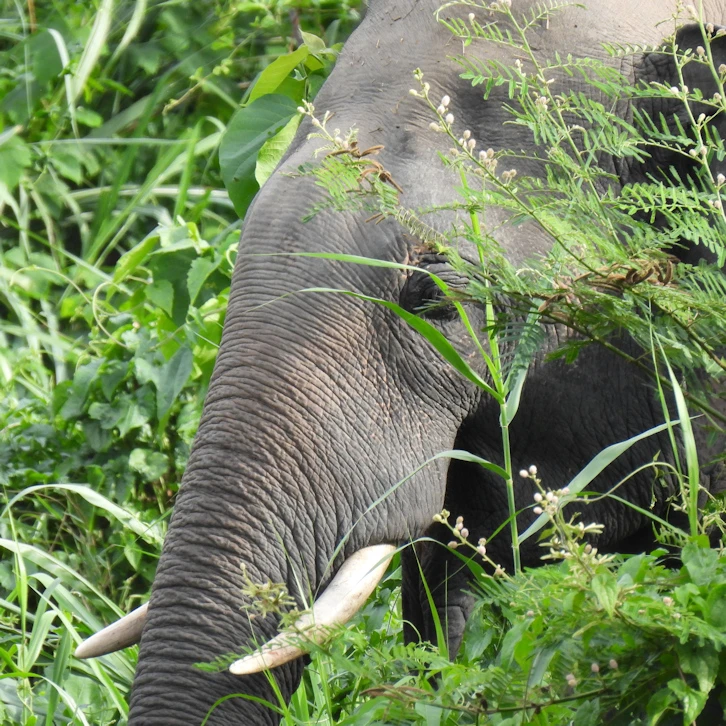
Global evidence suggests that intact forest landscapes such as these support higher biodiversity and larger carbon stocks than their disturbed counterparts, and should be prioritised when expanding protected area networks (Watson et al., 2018). But defining intactness is challenging, especially in landscapes that are underrepresented in the scientific literature. Measures of intactness are ideally calibrated for different forest types and historical disturbance regimes, the processes that reduce intactness. Using fossil pollen records of 283 tropical forest disturbance events, Cole et al. (2014) estimated highly variable recovery times ranging from 10 to 6,846 years, with a median of 210 years. Asian forests such as those on the Malay Peninsula had the slowest median recovery, at approximately 415 years. So how can we estimate forest intactness at the landscape scale, when there’s such high regional variability?
Between 2021 and 2026, I worked with Nature Based Solutions, Malaysia, developing remote sensing and machine learning frameworks to support the prioritisation and management of new protected areas in Peninsular Malaysia (Kelly et al., 2026b). Our team was tasked with prioritising forest reserves in the landscape south of Taman Negara National Park, Pahang, for conservation activities and protection from commercial logging. Tree cover in Malaysia can be broadly grouped into three management categories: plantations, such as oil palm and rubber; protected areas without logging; and commercially harvested forest reserves. Many forest reserves have been logged for the better part of a century, but spatially explicit logging records are not publicly available, if they exist at all. Historical satellite imagery may be used to detect forest disturbance, but reliable data only extend back to the 1990s. A forest without recent disturbance might still be recovering from much earlier events, perhaps even centuries ago. This leaves a substantial gap between the history we can observe and that which shaped a forest’s current biodiversity and carbon stocks. Comprehensive field surveys in such a large and rugged landscape are expensive and time-consuming, so we needed novel remote tools to identify forest reserves that either a) remained close to an old-growth state, or b) had the greatest potential for forest restoration and wildlife recovery.
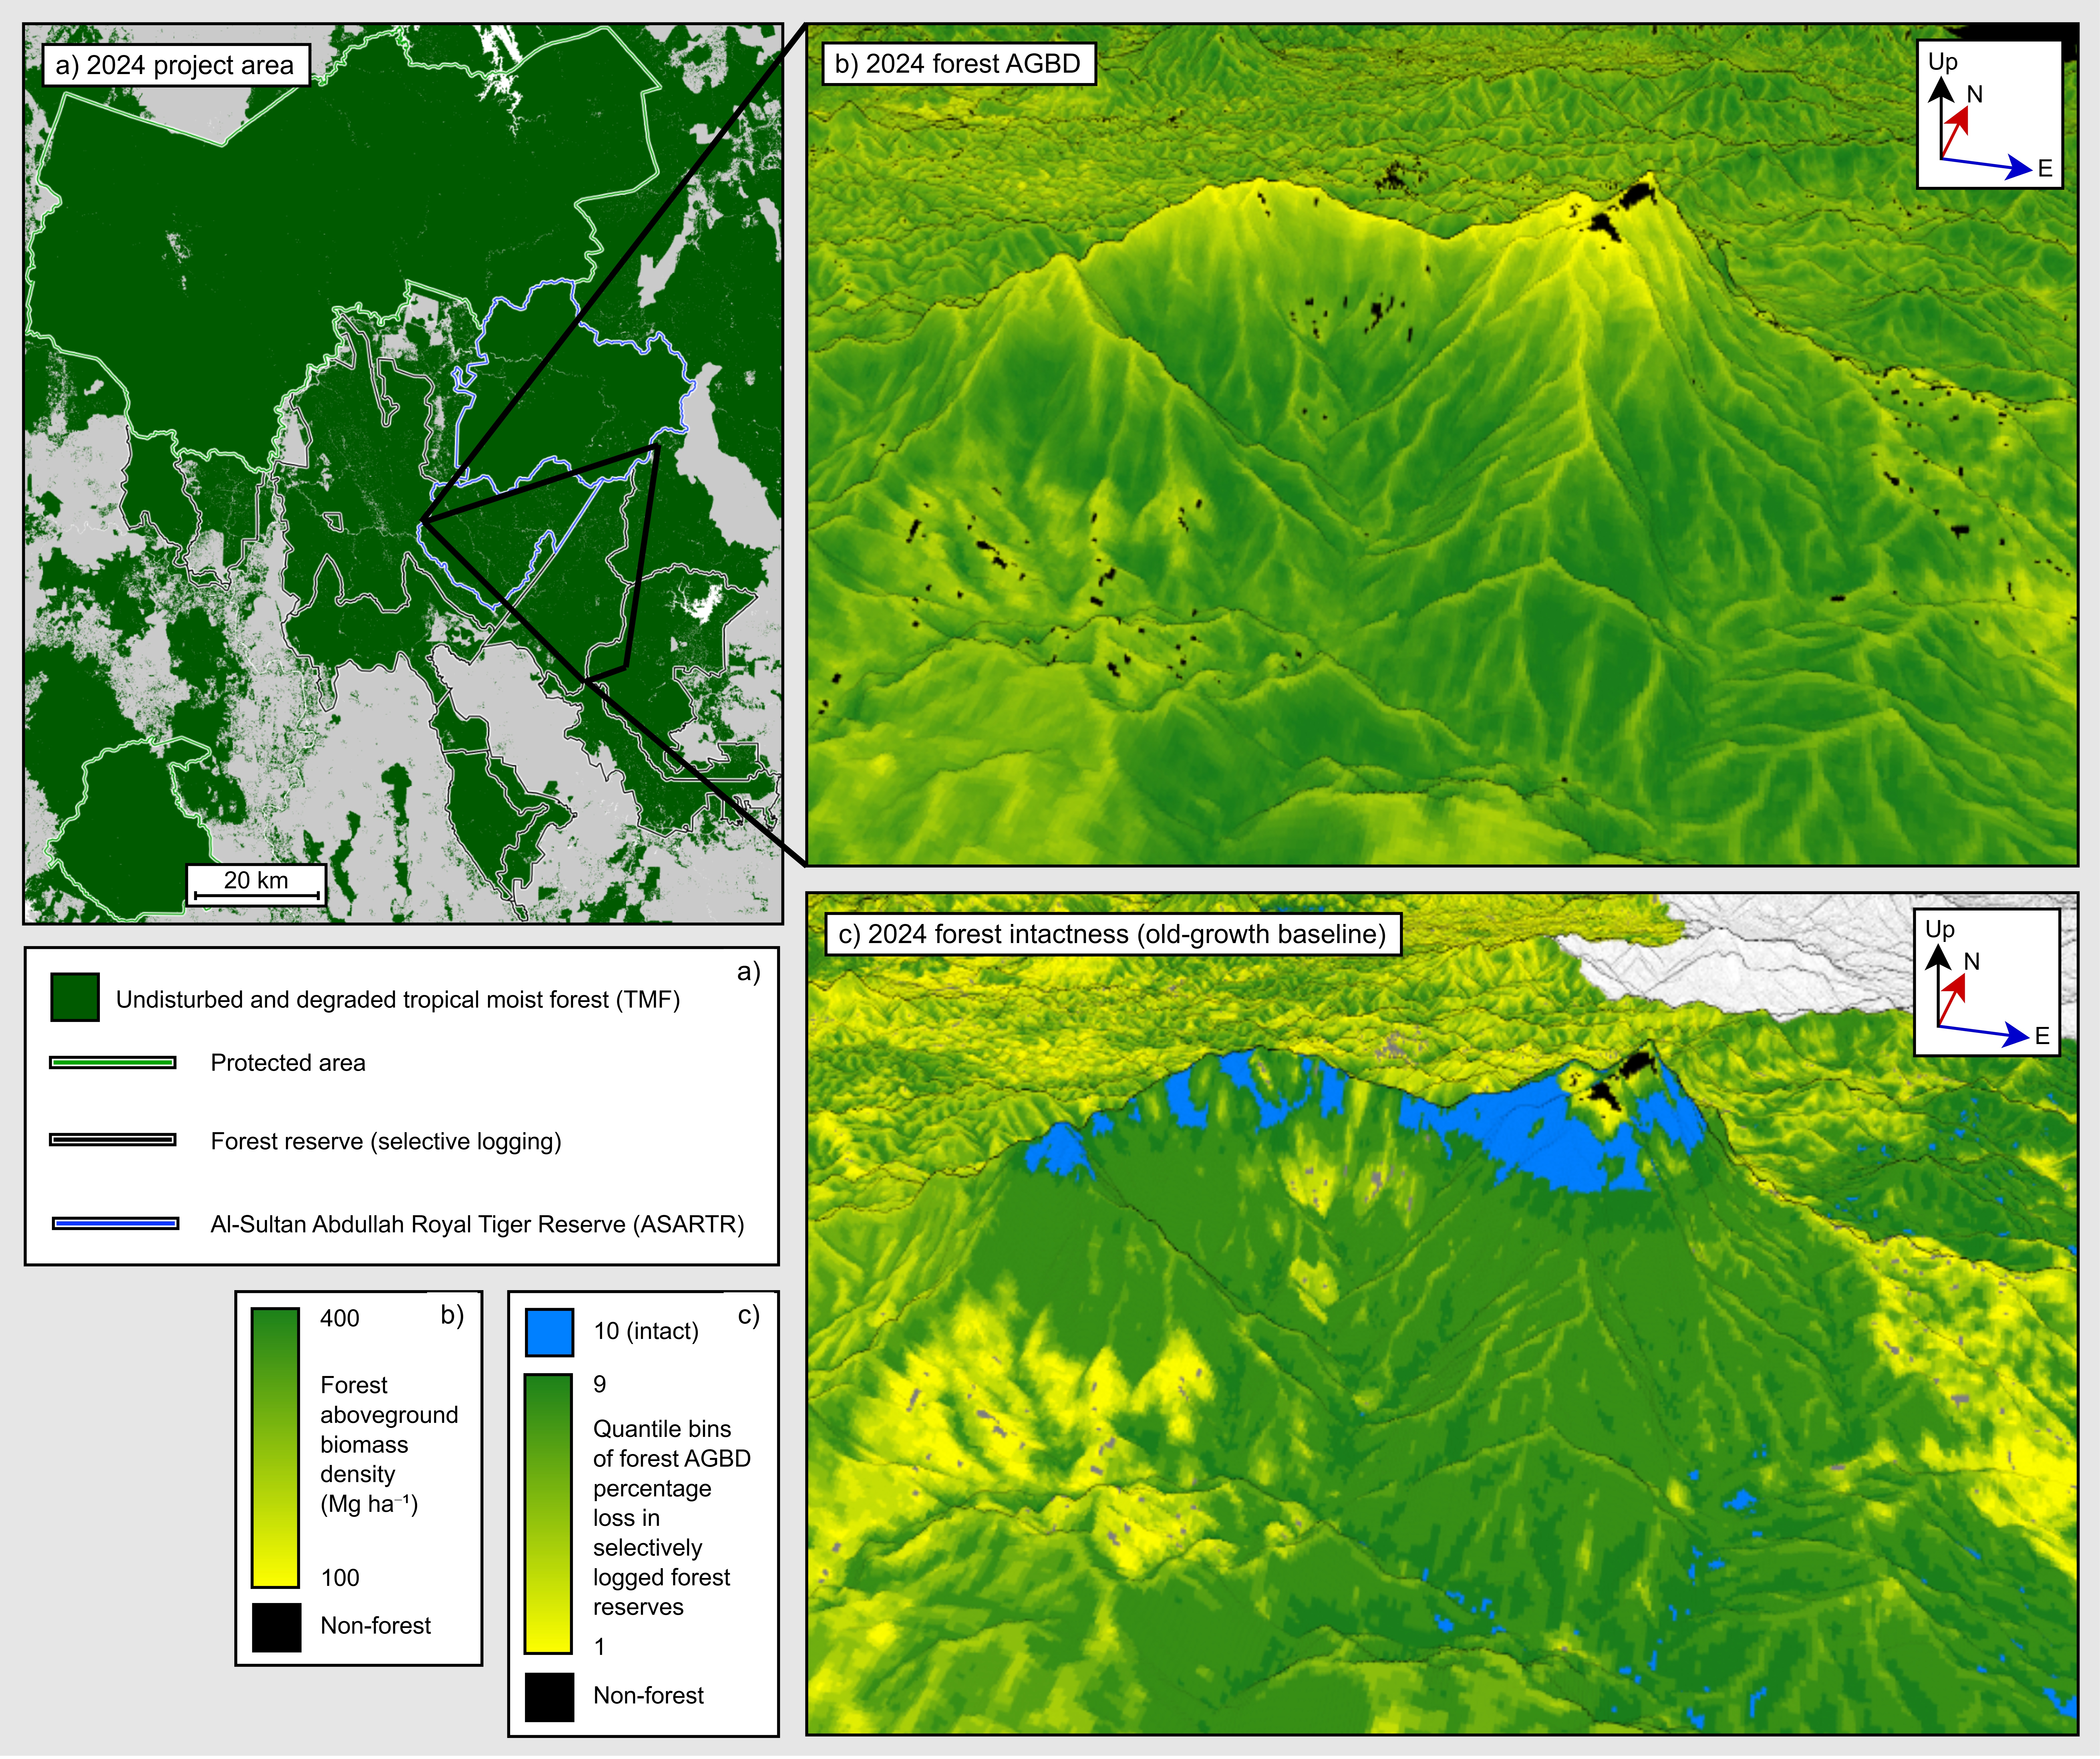
To this end, we developed a machine learning framework for mapping alternative scenarios of forest intactness, or MASFI (Kelly et al., 2026a). In a nutshell, MASFI compares the actual aboveground biomass (AGB) density of a forest to the maximum AGB density under local environmental constraints. AGB is essentially the dry weight of vegetation, the vast majority of which is made up of the dense, woody stems and branches of trees. Selective logging in Malaysia often removes some of the tallest and widest stems, reducing forests to approximately one half of their old-growth AGB. Trees of this size and density can take centuries to return, making forest AGB a useful indicator of the unrecorded disturbance history. However, the size and density of tree stems, and therefore AGB, are also limited by natural environmental conditions. An intact montane forest might hold only 150 tonnes of AGB per hectare, while a degraded lowland forest might still have 250 tonnes per hectare. Each location therefore needs its own baseline to determine relative intactness. Figure 1 illustrates the distinction using outputs from the MASFI framework. The forest on Mount Tapis’s ridges and summit has a relatively low AGB density, yet the montane forest there has never been logged. Forest on parts of the south-west slopes has undergone selective logging, but it still has a higher AGB density. Delineating a new protected area based on the absolute AGB alone (or other metrics such as canopy height) would therefore prioritise degraded forest over the ecologically intact forest above it.
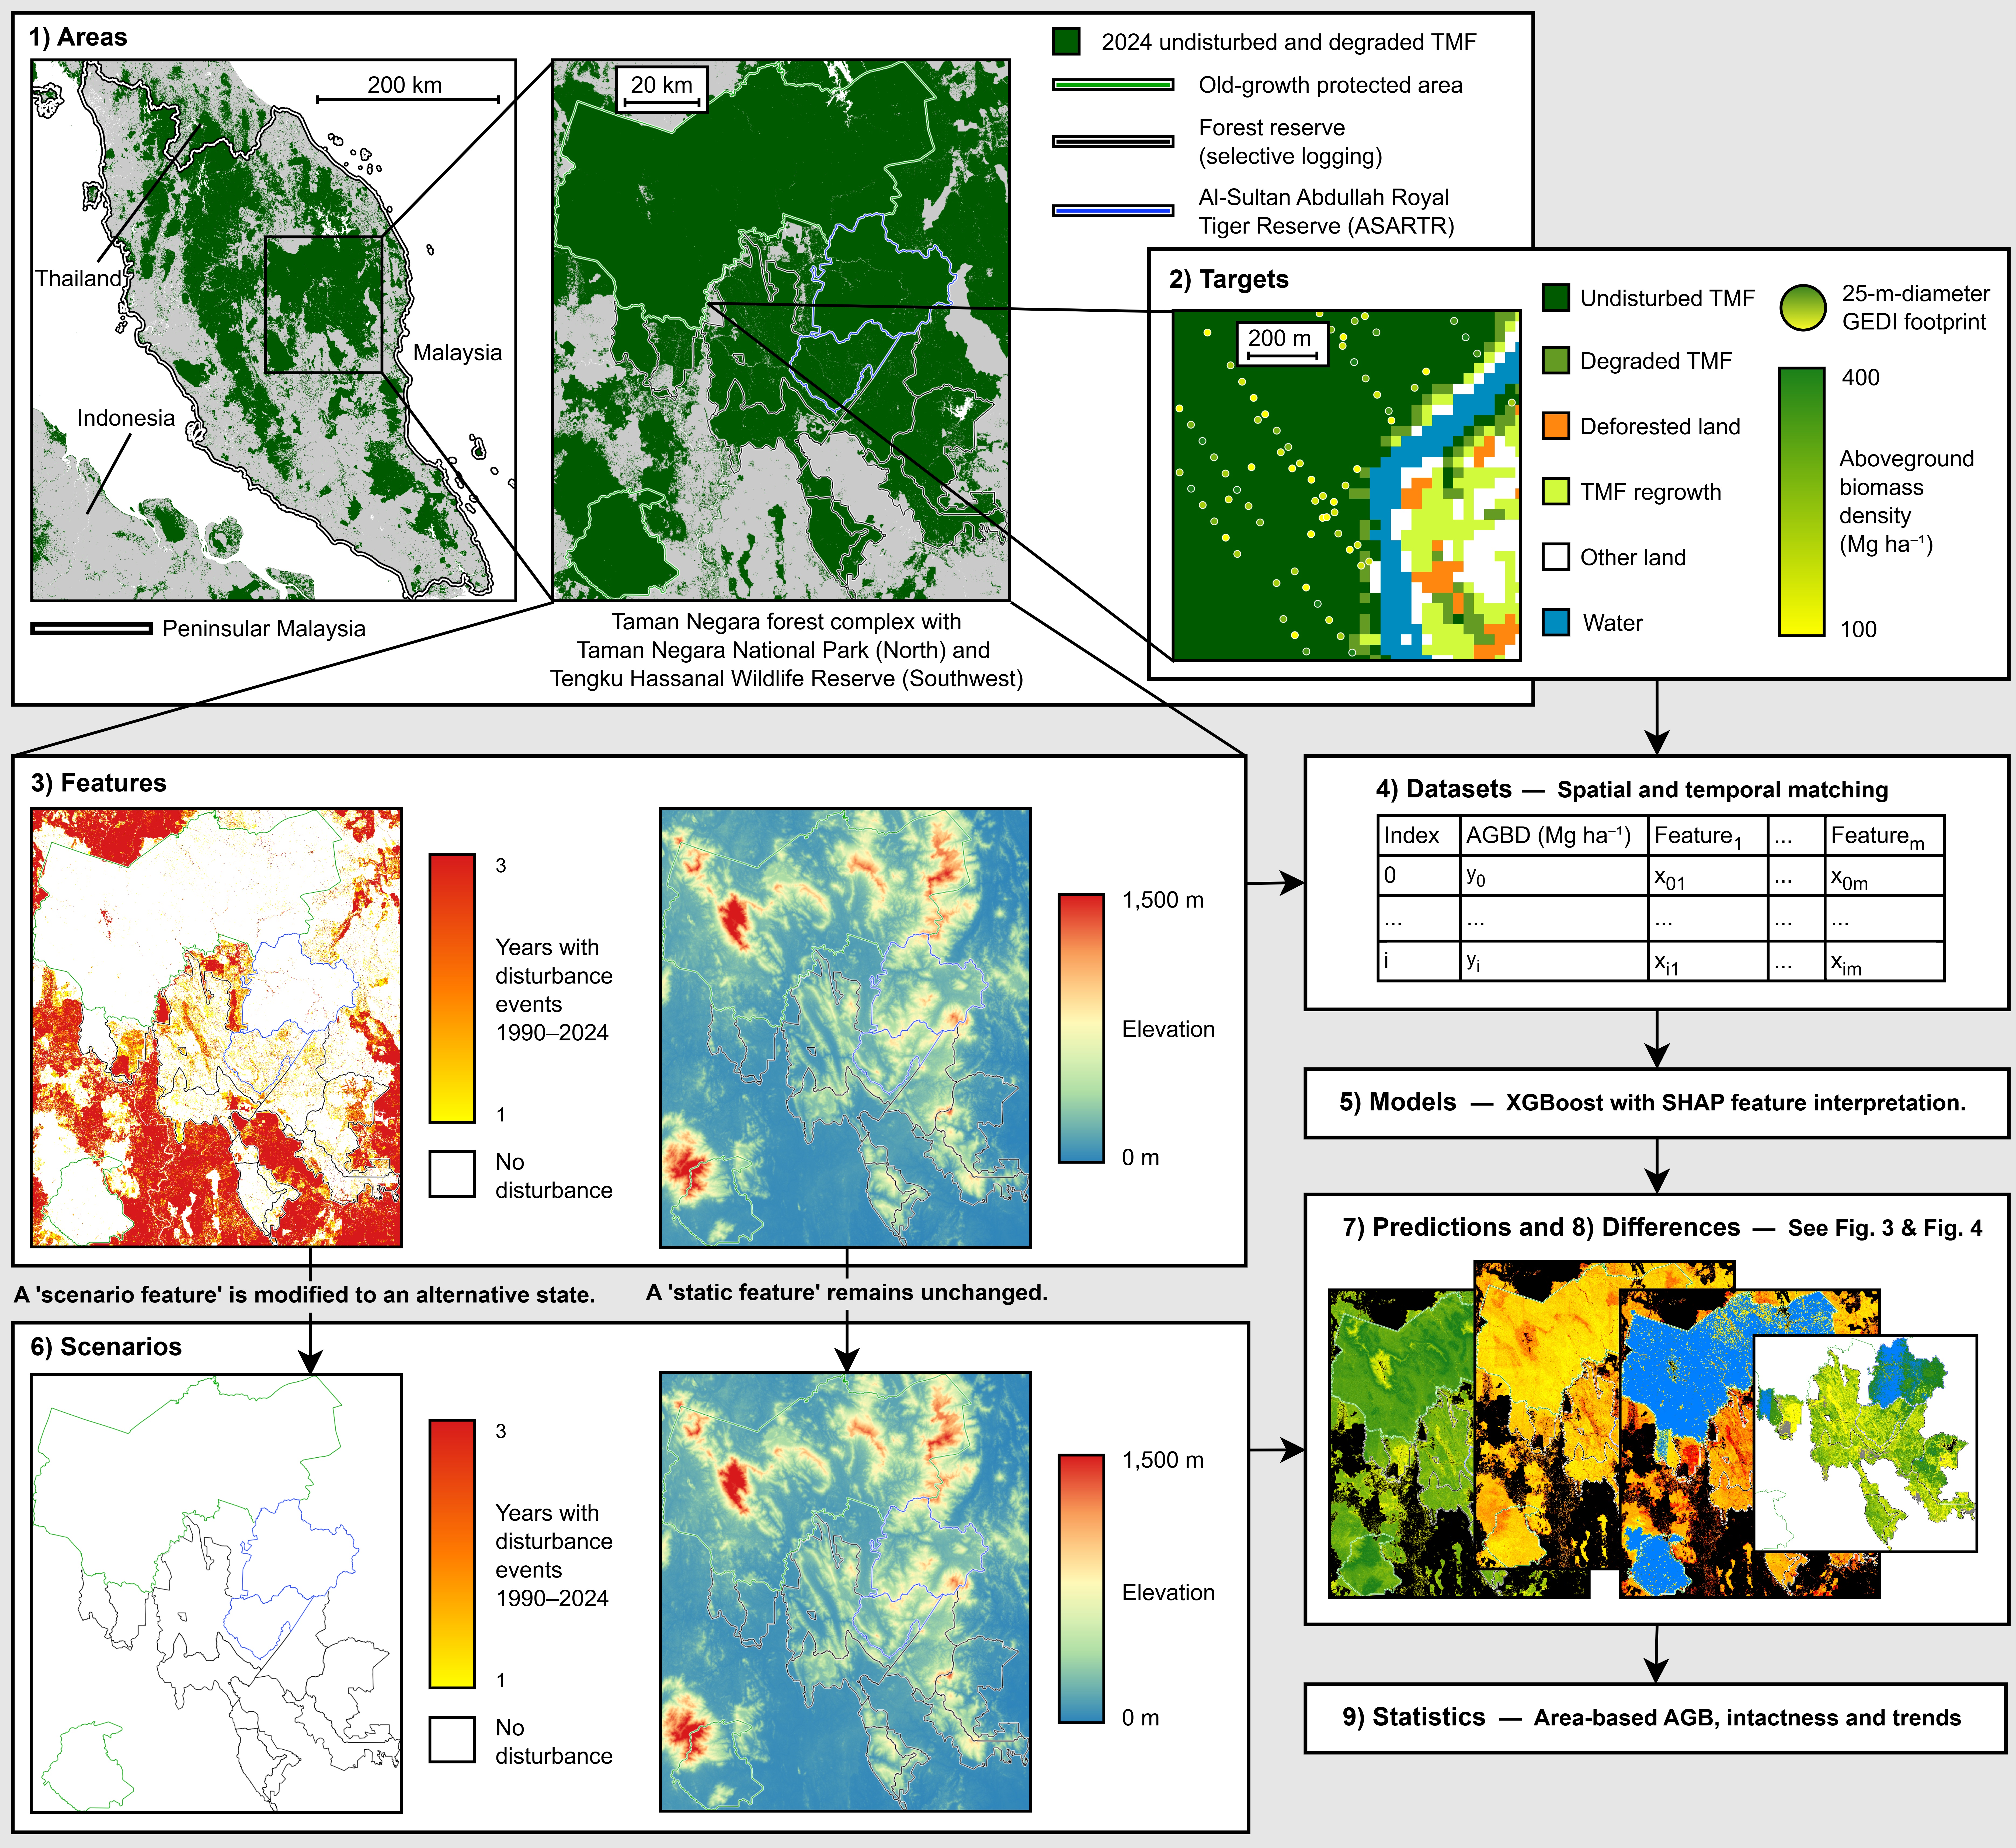
Continuous AGB maps are usually predicted from a dataset of discrete points, or ‘targets’, with gaps filled based on predictors, or ‘features’. We used hundreds of thousands of data points from the Global Ecosystem Dynamics Investigation (GEDI) as our targets. Its lidar instrument uses laser pulses to sample the vertical structure of vegetation from the International Space Station, in footprints about 25 m across. The structure was translated into AGB density by the GEDI team using relationships established through field inventories. These were combined with forest edge, disturbance, topography and geographic information features to train a machine learning regression model, XGBoost. The model could predict actual and alternative scenarios by modifying certain features at the prediction stage, while fixing the static features like topography (Figure 2).
In one scenario, all disturbance detected from satellite imagery was removed. The result represented the state of AGB had there been no disturbance since 1996, as far back as we could reliably detect disturbance using those data. But the legacy of logging went much further than that, so we also created a scenario whereby old-growth forest covered the entire project area. Local experts knew that the forest in adjacent protected areas had never been logged, so old-growth status had been included in the model as a feature. The forest AGB in both alternative scenarios could then be compared with the actual state, allowing us to calculate the relative intactness of every forest pixel in the map from two baselines (Figure 3).

We were also able to use the differences between scenarios to estimate the absolute biomass shortfall caused by disturbance, either since 1996 or since an old-growth state (Figure 4). The inverse of the latter baseline could be taken as the forest’s restoration potential. We inferred that 60% of the project area’s disturbance pre-dated satellite imagery, highlighting the importance of old-growth proxies as baselines. Tests which held out parts of Taman Negara National Park correctly identified them as old-growth forest, supporting the results of the MASFI framework in this landscape.
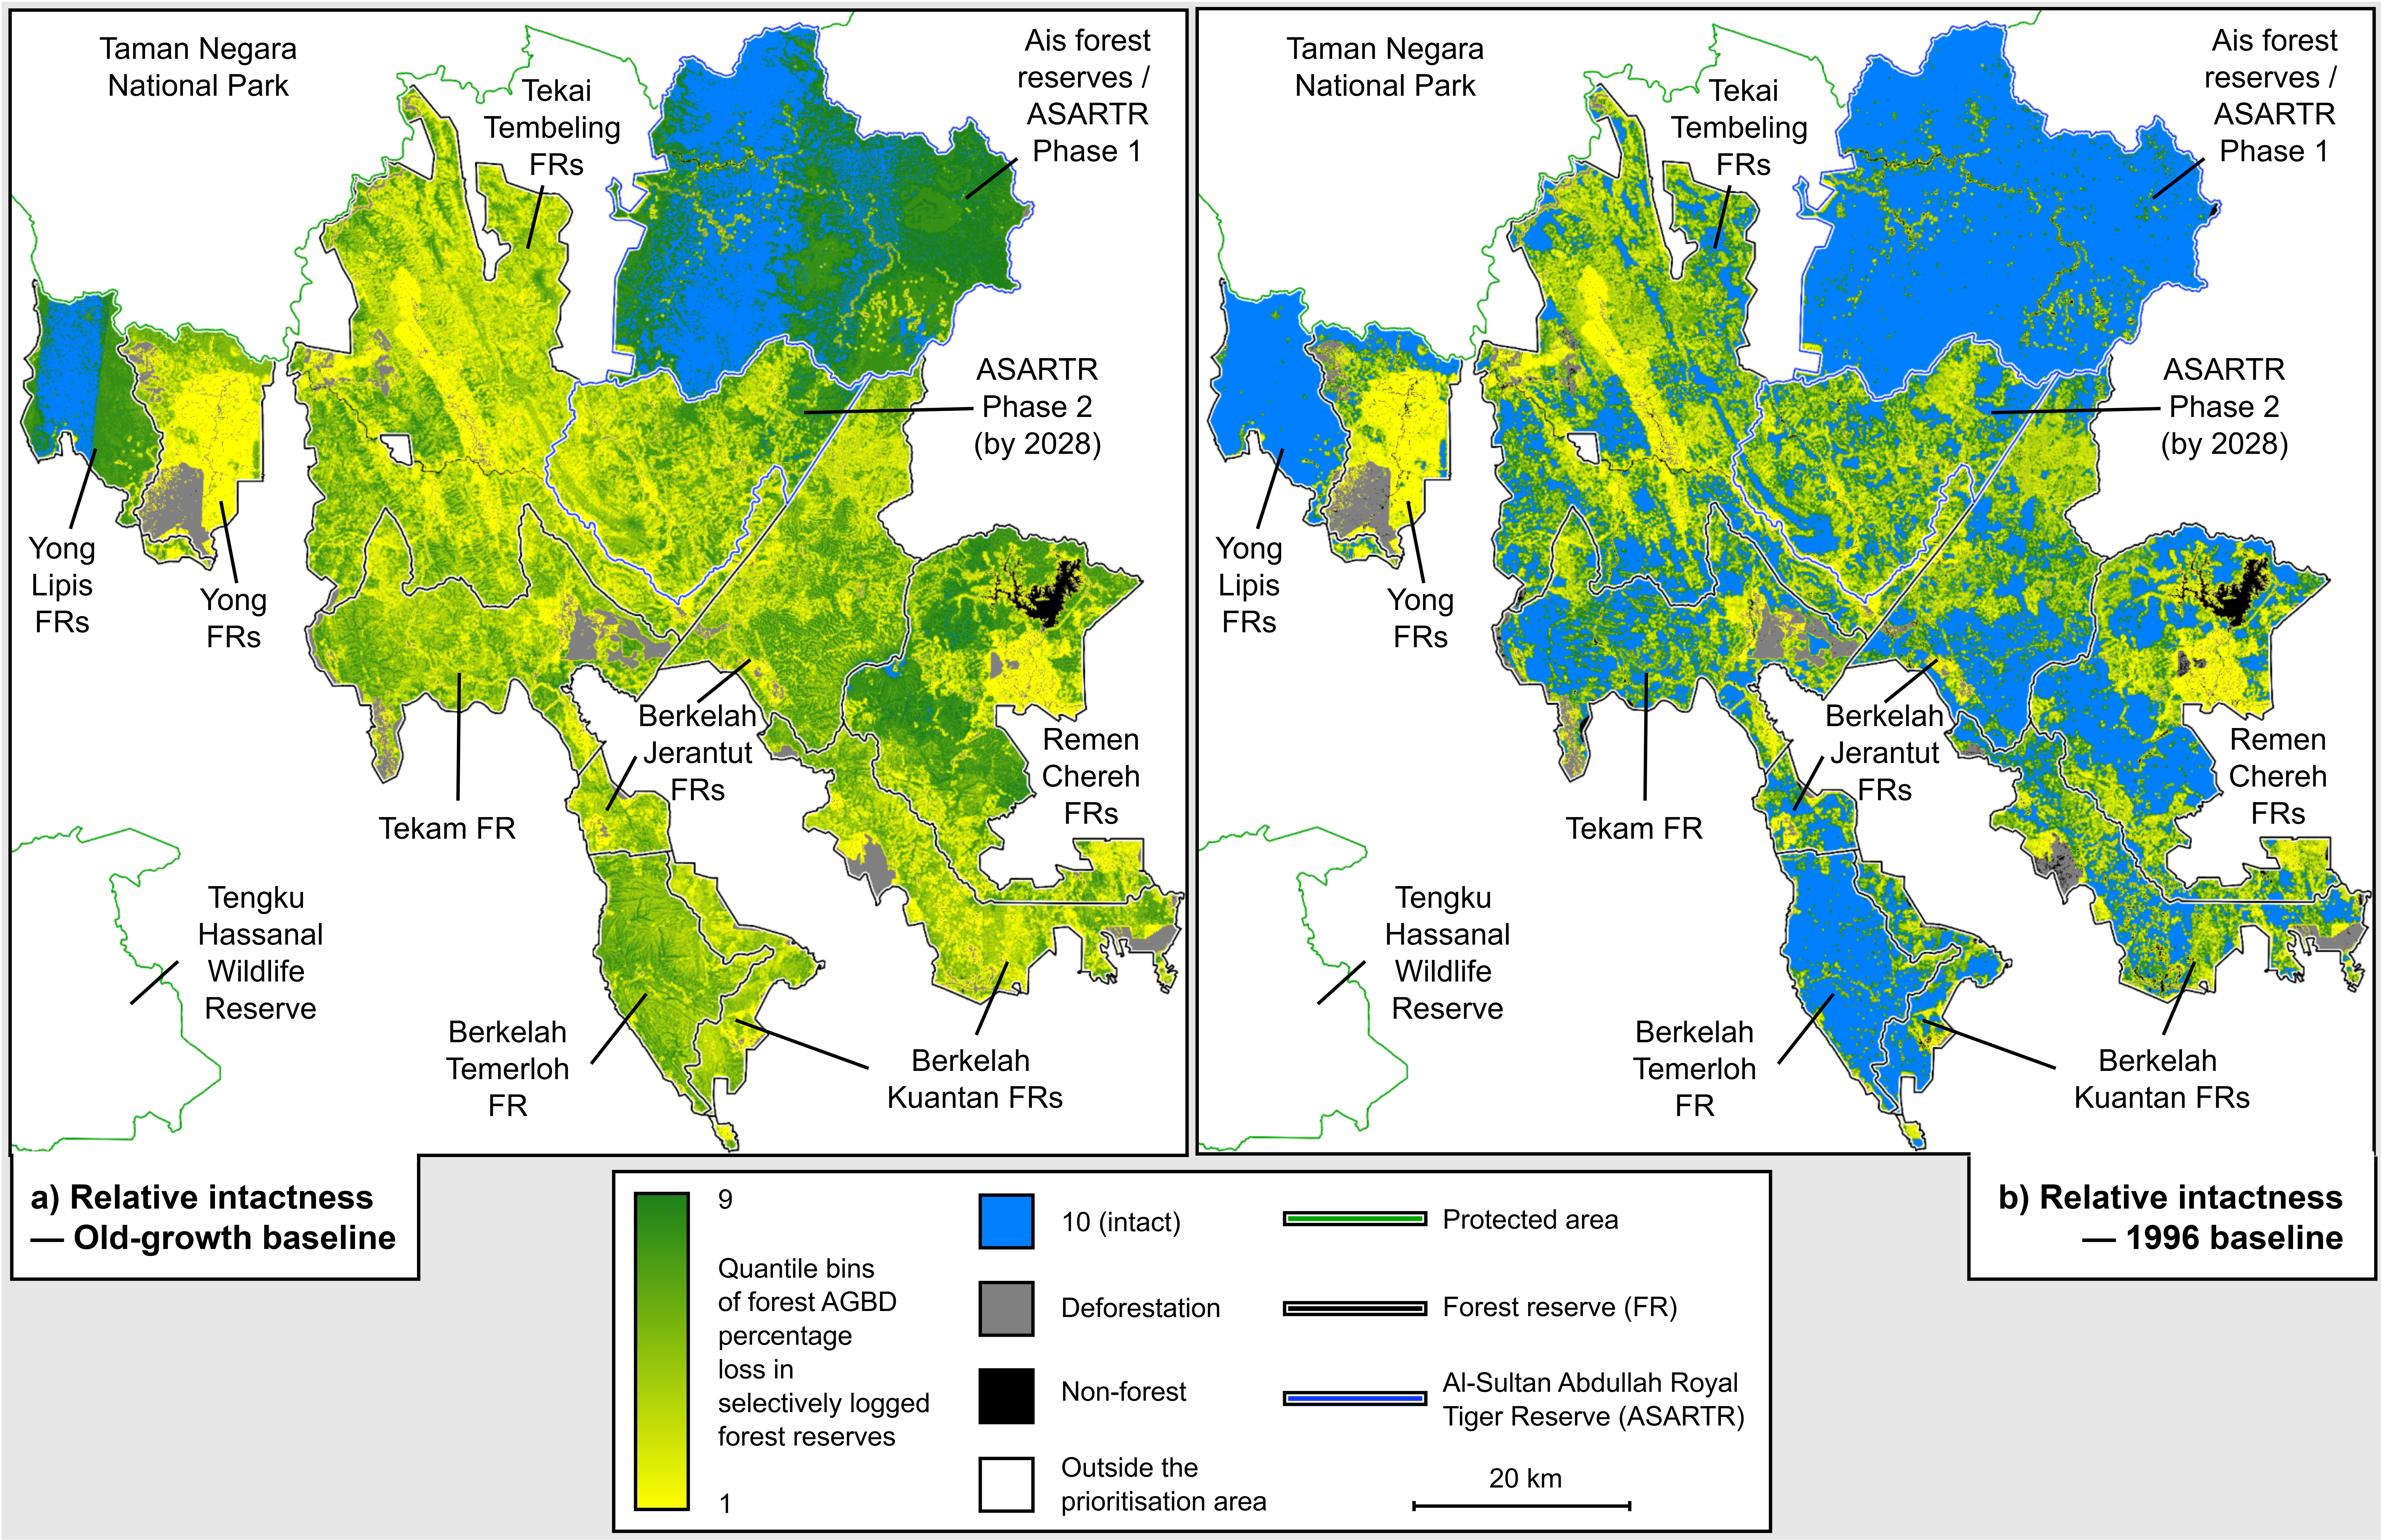
Conservation resources are finite, and effective prioritisation often depends on such baselines, be it forest condition or wildlife populations. The MASFI framework was developed for application to real-world delineation and management of new protected areas. In 2022, these outputs provided strong evidence that 924 km² of forest adjacent to Taman Negara National Park was intact, old-growth forest. This area was formally gazetted as Phase 1 of the Al-Sultan Abdullah Royal Tiger Reserve (ASARTR) in 2023. A second area dubbed ‘Phase 2’ (416 km²) is planned for gazettement by 2028. The forest in Phase 2 is mostly degraded, but was predicted to have a high restoration potential, and found to harbour Tiger, Asian Elephant and Gaur. While the forest in Phase 2 recovers to its original state, the adjacent old-growth forest in Phase 1 will serve as an important biological reservoir from which forest specialists can recolonise.
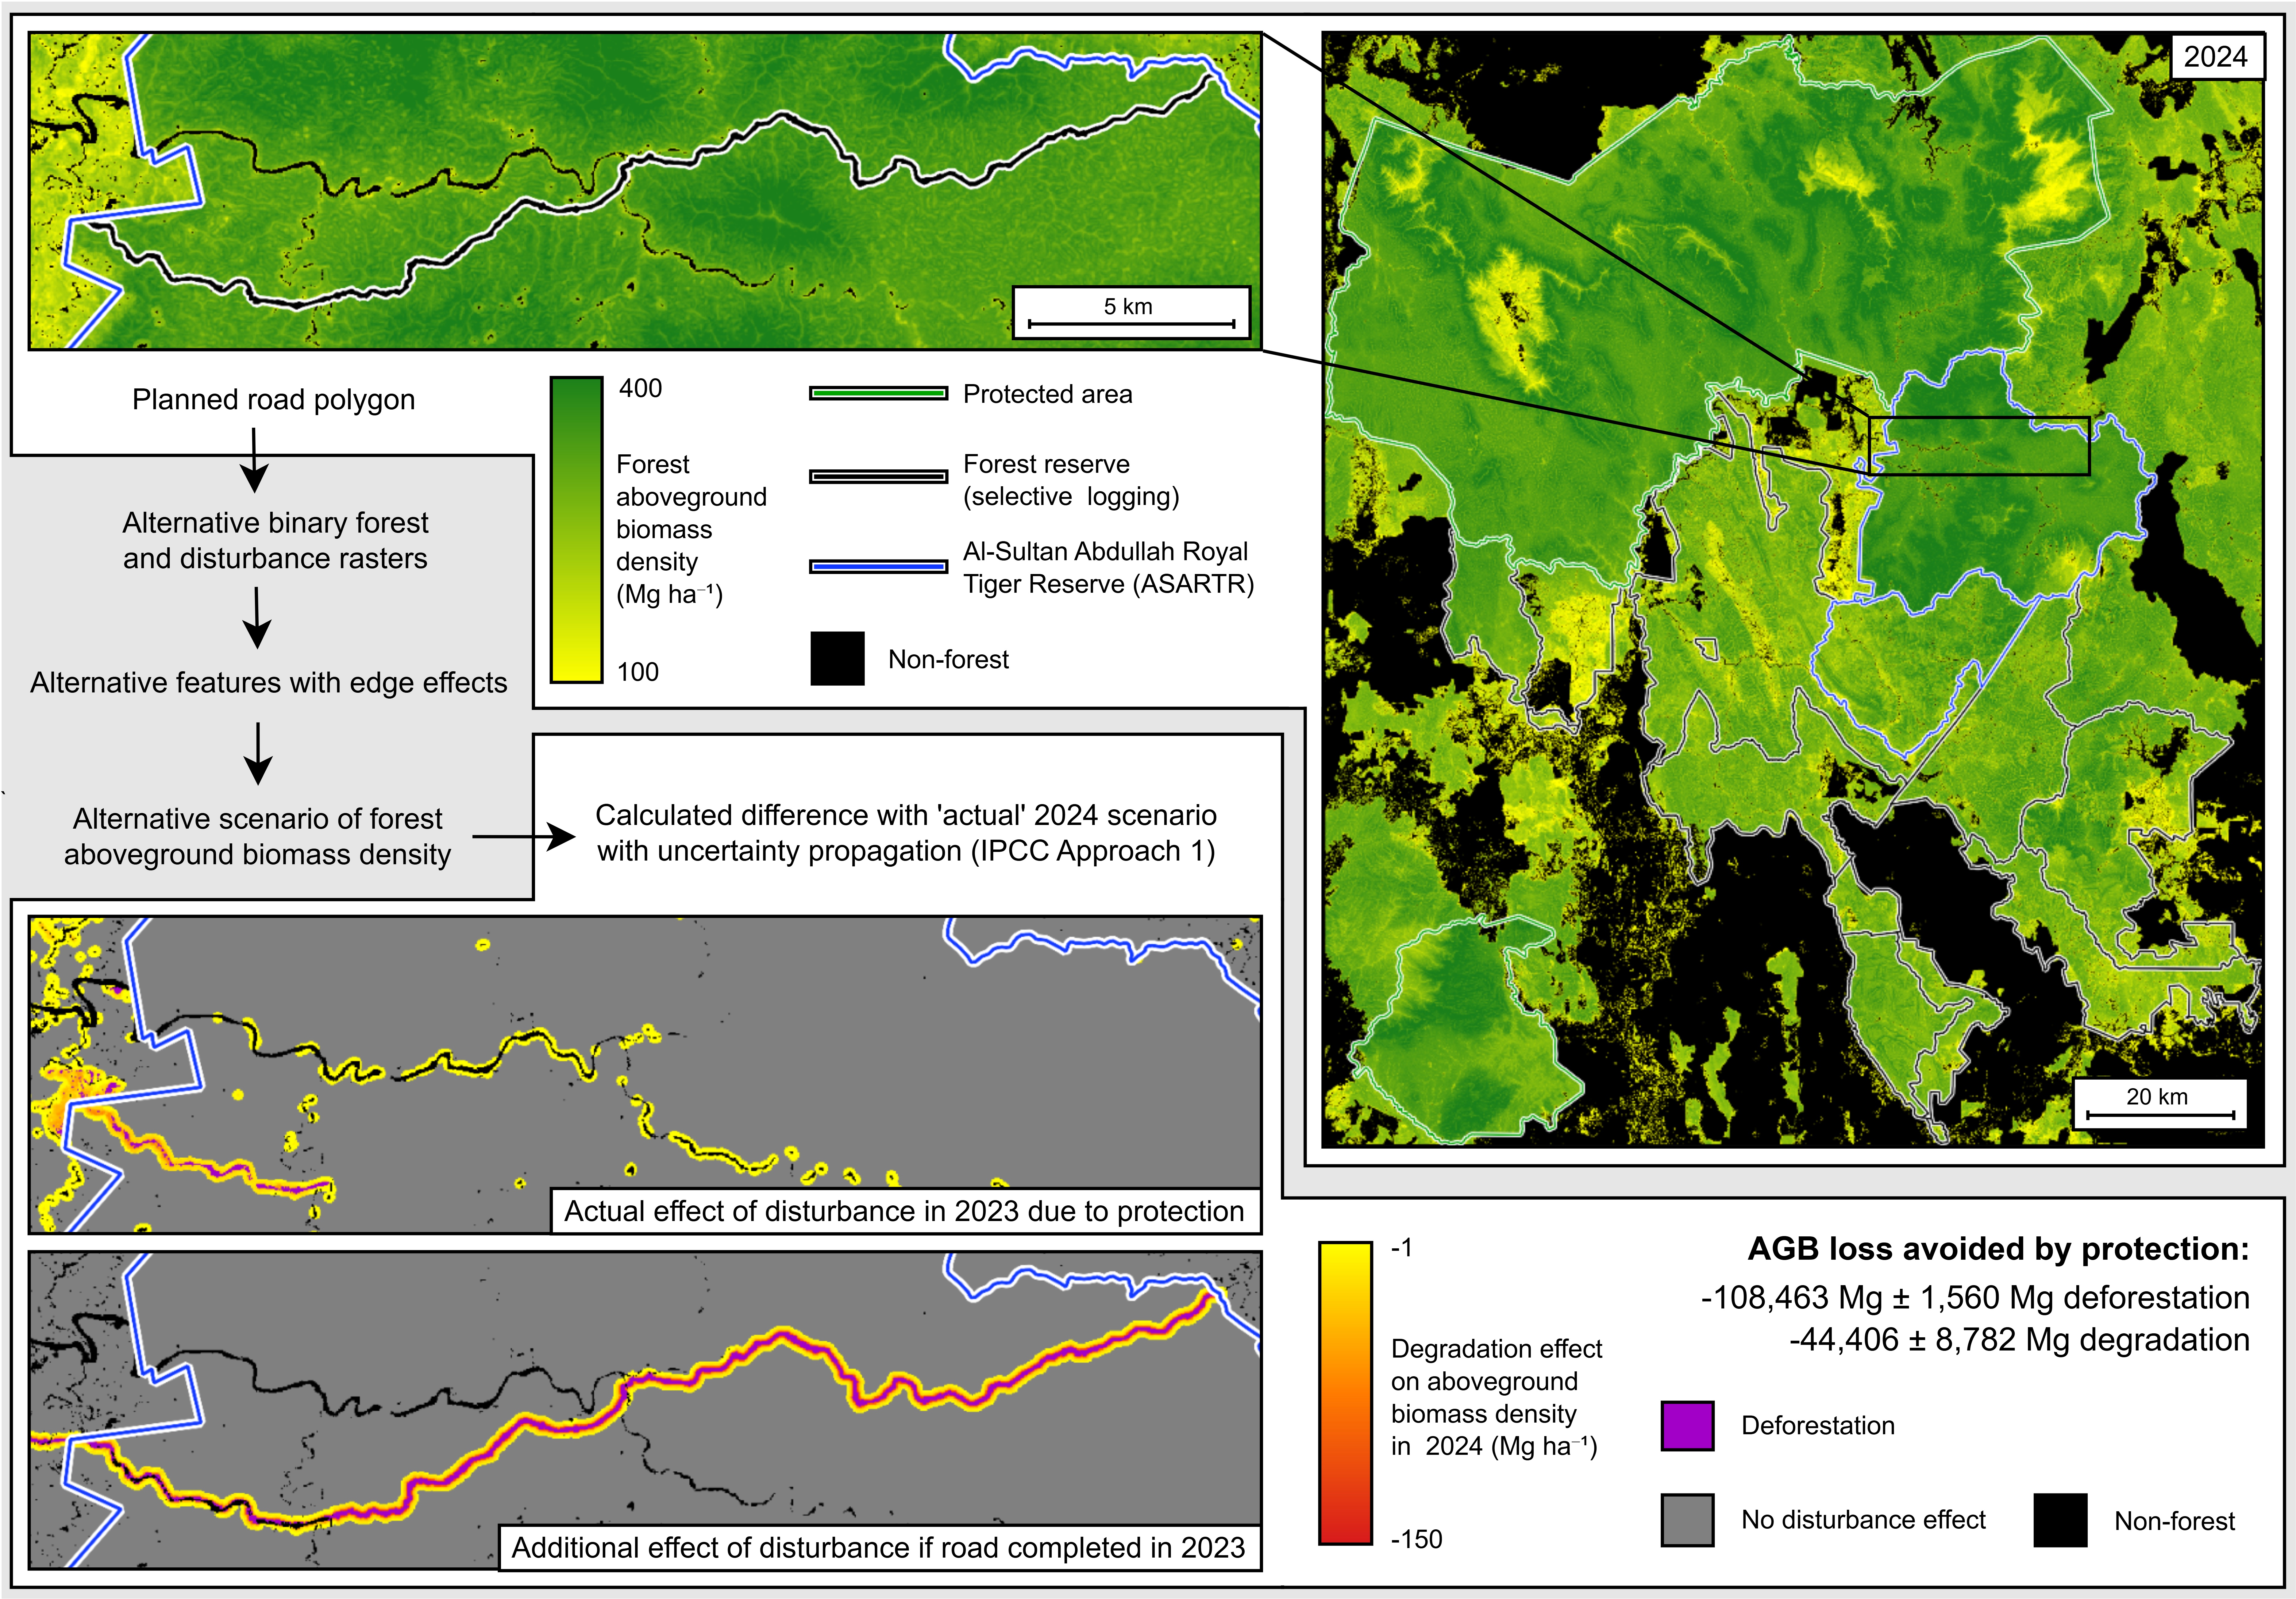
The most immediate effect of the gazettement of ASARTR was the cancellation of an interstate highway, which would have formed a barrier between the reserve and Taman Negara National Park. Not only could the road have been deadly for some animals, but its construction would have cleared a significant area of old-growth rainforest. MASFI was used to create an alternative scenario for the completion of the road, which predicted that ~153,000 tonnes of aboveground biomass would have been lost (Figure 5). This would have included ~108,000 tonnes from deforestation and ~44,000 tonnes from degradation (biomass lost while forest cover remains) along the exposed forest edges, where changes in microclimate can increase tree mortality.
ASARTR is Malaysia’s first tiger reserve, and an important new node in the global network of tiger conservation initiatives. The MASFI framework was originally built to support protected area management in Malaysia, but has since been developed into a set of user-friendly Jupyter notebooks, free to use with Google Colab and applicable to any project area in the tropical moist forest biome. Our application and methods are available in co-submitted articles currently under review: Prioritising forest protection and restoration using alternative scenarios of intactness; and Mapping alternative scenarios of forest intactness: A machine learning framework, an in-depth protocol. Early development of MASFI was supported by UK PACT (Partnering for Accelerated Climate Transitions) under the project ‘Hutanomics: Developing frameworks to enable private sector investments into nature-based climate solutions in Terengganu, Malaysia’ (project number 301495). It was completed with funding facilitated by the Rainforest Trust for Panthera (project code 3-MY-1159-23-1-a, ‘Malaysia—Tembeling State Park’).
References
Cole, L. E. S., Bhagwat, S. A., & Willis, K. J. (2014). Recovery and resilience of tropical forests after disturbance. Nature Communications, 5(1), 3906. https://doi.org/10.1038/ncomms4906
Kelly, J., Ong, D. J., Clements, G. R., Low, R., Senescall, M., Zeng, Y., Rao, S., & Jinggut, T. (2026a). Mapping alternative scenarios of forest intactness: A machine learning framework. SSRN Preprint. https://ssrn.com/abstract=7269979
Kelly, J., Ong, D. J., Clements, G. R., Low, R., Senescall, M., Zeng, Y., Rao, S., & Jinggut, T. (2026b). Prioritising forest protection and restoration using alternative scenarios of intactness. SSRN Preprint. https://doi.org/10.2139/ssrn.7259344
Tamizi, A. A., Mohamad, S., Rahman, A. A. A., Mustafa, S. N., Hamdin, M. S., & Zakaria, M. Z. (2025). DNA barcoding, prey spectrum analysis, and vegetative propagation of Nepenthes mirabilis × rafflesiana, a rarely sighted pitcher plant hybrid from Peninsular Malaysia. Journal of Tropical Biodiversity and Biotechnology, 10(2). https://doi.org/10.22146/jtbb.12951
Watson, J. E. M., Evans, T., Venter, O., Williams, B., Tulloch, A., Stewart, C., Thompson, I., Ray, J. C., Murray, K., Salazar, A., McAlpine, C., Potapov, P., Walston, J., Robinson, J. G., Painter, M., Wilkie, D., Filardi, C., Laurance, W. F., Houghton, R. A., … Lindenmayer, D. (2018). The exceptional value of intact forest ecosystems. Nature Ecology & Evolution, 2(4), 599–610. https://doi.org/10.1038/s41559-018-0490-x
Image attributions
Species photographs in top-left to bottom-right order, cropped versions of the Wikimedia originals. My cropped versions of photographs 1, 2, 3 and 6 are offered under the same licences as their originals.
- Mountain Peacock-Pheasant: Godbolemandar, Wikimedia Commons. CC BY-SA 4.0.
- Robinson’s Forest Dragon: Bernard Dupont, Wikimedia Commons. CC BY-SA 2.0.
- Kerr's Rafflesia: Ahoerstemeier, Wikimedia Commons. CC BY-SA 3.0.
- Tiger: andibreit (Pixabay), Wikimedia Commons. CC0 1.0.
- Asian Elephant: Joseph Kelly.
- Gaur: Ras67, Wikimedia Commons. CC BY-SA 4.0.


